OpenStreetMap

mcld's Diary

Recent diary entries

Solar panels in the UK - 100,000 spotted!

Posted by mcld on 12 September 2019 in English.

The OpenStreetMap UK community has come together for a 3-month “quarterly project” to find all the solar panels in the UK. And the results so far… wow!

-> We’ve just reached over 100,000 standalone solar PV installations mapped in the UK!

-> Plus we also have almost 600 solar farms mapped, representing almost 5 gigawatts!

To give you an idea of completeness: the UK government believes there are about 1 million solar panels in the UK, and official solar farm listings have about 8 GW. What we’ve mapped so far is way more than I thought we’d manage, so I really deeply want to thank every person who contributed, large or small. We can use these data to pilot CO2-saving initatives - and so can anyone else. Open data for the win!

Here are a couple of simple plots from me, to show where the items are in the UK. (The data I’ve used are from yesterday, which is why my plot says not-quite-100,000 items.) I’ve plotted two different types of item: (1) “standalone” solar panels (i.e. ones that are not inside solar farms); (2) solar farms. You’ll notice the distributions are really different:

(The images aren’t showing up…. you’ll have to view them on my blog where I originally posted this)

Some of the darkest blobs on the map are evidence of focussed effort. I know that Jerry (SK53) has been mapping around Nottingham, Cornwall and other areas, so may be the source of some of these blobs. We’ve shown that with some local effort, and a bit of scanning through imagery, a lot of this can be done.

You’ll notice that many of the solar farms are in the southern part of the UK, at least according to our data. That’s not unexpected!

For more detailed data breakdowns, you can peruse Gregory Williams’ solar mapping analysis site.

We have more time to go until the end of the quarter… and we’ll be able to use the data for sustainable energy projects whenever you contribute - so please do join in!

Mapping larger solar farms in England

Posted by mcld on 29 March 2019 in English.

I’ve had a look at mapping solar farms in England. By “solar farms” I mean the large field-scale things.

A few years ago someone put this very useful List of under construction and operational UK Ground Mounted Solar Farms on the wiki, sourced from the “REPD”.

I’ve been through and checked for every item in that table which is rated as >= 30 MW. About two thirds of them were already there. The rest were easy to map because very visible in DigitalGlobe imagery - most of them were not visible in Bing imagery because the latter is a few years old, and many solar farms are new.

(One of my changesets.)

In some cases I’ve used a single power=generator way, but in most cases they’re a power=plant relation. The tagging is generally like this:

generator:output:electricity 	31.6 MW
name 	Broxted Solar Farm
power 	plant
repd:id 	1592
source:generator:output:electricity 	repd
type 	site

This is in ADDITION to the tagging of solar panel areas using the PV tagging described here

I’m broadly following the approach in the wiki page with the big REPD list. The repd:id is useful to be able to join the dots later.

Spotting solar panels in London

Posted by mcld on 11 March 2019 in English.

Jack had this great idea to find the locations of solar panels and add them to OpenStreetMap. (Why’s that useful? He can explain: Solar PV is the single biggest source of uncertainty in the National Grid’s forecasts.)

I think we can do this :) The OpenStreetMap community have done lots of similar things, such as the humanitarian mapping work we do, collaboratively adding buildings and roads for unmapped developing countries. Also, some people in France seem to have done a great job of mapping their power network (info here in French). But how easy or fast would it be for us to manually search the globe for solar panels?

(You might be thinking “automate it!” Yes, sure - I work with machine learning in my day job - but it’s a difficult task even for machine learning to get to the high accuracy needed. 99% accurate is not accurate enough, because that equates to a massive number of errors at global scale, and no-one’s even claiming 99% accuracy yet for tasks like this. For the time being we definitely need manual mapping or at least manual verification.)

(Oh, or you might be thinking “surely someone officially has this data already?” Well you’d be surprised - some of it is held privately in one database or other, but not with substantial coverage, and certainly almost none of it has good geolocation coordinates, which you need if you’re going to predict which hours the sun shines on each panel. Even official planning application data can be out by kilometres, sometimes.)

Jerry (also known as “SK53” on OSM) has had a look into it in Nottingham - he mapped a few hundred (!) solar panels already. He’s written a great blog article about it.

This weekend here in London a couple of us thought we’d have a little dabble at it ourselves. We assumed that the aerial imagery must be at least as good as in Nottingham (because that’s what London people think about everything ;) so we had a quick skim to look. Now, the main imagery used in OSM is provided by Bing, and unfortunately our area doesn’t look anywhere near as crisp as in Nottingham.

We also went out and about (not systematically) and noticed some solar panels here and there, so we’ve a bit of ground truth to put alongside the aerial imagery. Here I’m going to show a handful of examples, using the standard aerial imagery. The main purpose is to get an idea of the trickiness of the task, especially with the idea of mapping purely from aerial imagery.

It took quite a lot of searching in aerial imagery to find any hits. Within about 30 minutes we’d managed to find three. Often we were unsure, because the distinction between solar panels, rooftop windows or other rooftop infrastructure is hard to spot unless you’ve got crystal-clear imagery. We swapped back and forth with various imagery sources, but none of the ones we had available by default gave us much boost.

While walking around town we saw a couple more. In the following image (of this location), the building "A" had some stood-up solar panels we saw from the ground; it also looks like "B" had some roof-mounted panels too, but we didn't spot them from the ground, because they don't stick up much.

Solar example

Finally this picture quite neatly puts 3 different examples right next to each other in one location. At first we saw a few solar panels mounted flush on someone’s sloping roof (“A”), and you can see those on the aerial - though my certainty comes from having seen them in real life! Then next to it we saw some stood-up solar panels on a newbuild block at “B”, though you can’t actually see it in the imagery because the newbuild is too new for all the aerials we had access to. Then next to that at “C” there definitely looks to be some solar there in the aerials, though we couldn’t see that from the ground.

Solar example

Our tentative learnings so far:

  • We will need to use a combination of aerial mapping and on-the-ground “solar spotting” from people.
  • Whether on-the-ground or aerial, it’s often hard to get a clear idea of the size of the installation. In lieu of that, maybe it’s fine to map them as points rather than areas. People can come along later and tell us the actual power ratings, efficiencies etc.
  • We will need to make the most of heuristics about where to find solar panels. For example Jerry notes that social housing is relatively likely to install solar, and I’ve noticed it on plenty of schools too; there may also be vendor/official lists (e.g. planning applications) out there - we’ll need multiple sources to get a well-rounded coverage.

See Jerry’s blog for more learnings.

There are plenty of virtuous feedback loops in here: the more we do as a community, the better we’ll get (both humans and machines) at finding the solar panels and spotting the gaps in our data.

(This article is cross-posted from my own blog)

Cross posted from mcld.co.uk

On Wednesday we had a “flagship seminar” from Prof Andy Hopper on Computing for the future of the planet. How can computing help in the quest for sustainability of the planet and humanity?

Lots of food for thought in the talk. I was surprised to come out with a completely different take-home message than I’d expected - and a different take-home message than I think the speaker had in mind too. I’ll come back to that in a second.

Some of the themes he discussed:

  • Green computing. This is pretty familiar: how can computing be less wasteful? Low-energy systems, improving the efficiency of computer chips, that kind of thing. A good recent example is how DeepMind used machine learning to reduce the cooling requirements of a Google data centre by 40%. 40% reductions are really rare. Hopper also have a nice example of “free lunch” computing - the idea is that energy is going unused somewhere out there in the world (a remote patch of the sea, for example) so if you stick a renewable energy generator and a server farm there, you essentially get your computation done at no resource cost.
  • Computing for green, i.e. using computation to help us do things in a more sustainable way. Hopper gave a slightly odd example of high-tech monitoring that improved efficiency of manufacturing in a car factory; not very clear to me that this is a particularly generalisable example. How about this much better example? Open source geospatial maps and cheap new tools improve farming in Africa. “Aerial drones, crowds of folks gathering soil samples and new analysis techniques combine as pieces in digital maps that improve crop yields on African farms. The Africa Soil Information Service is a mapping effort halfway through its 15-year timeline. Its goal is to publish dynamic digital maps of all of Sub-Saharan Africa at a resolution high enough to serve farmers with small plots. The maps will be dynamic because AfSIS is training people now to continue the work and update the maps.” - based on crowdsourced and other data, machine-learning techniques are used to create a complete picture of soil characteristics, and can be used to predict where’s good to farm what, what irrigation is needed, etc. * While we’re on the subject of computing-for-green - have a look at Jack Kelly’s excellent list of tips Climate change mitigation for hackers

Then Hopper also talked about replacing physical activities by digital activities (e.g. shopping), and this led him on to the topic of the Internet, worldwide sharing of information and so on. He argued (correctly) that a lot of these developments will benefit the low-income countries even though they were essentially made by-and-for richer countries - and also that there’s nothing patronising in this: we’re not “developing” other countries to be like us, we’re just sharing things, and whatever innovations come out of African countries (for example) might have been enabled by (e.g.) the Internet without anyone losing their own self-determination.

Hopper called this “wealth by proxy”… but it doesn’t have to be as mystifying as that. It’s a well-known idea called the commons.

The name “commons” originates from having a patch of land which was shared by all villagers, and that makes it a perfect term for what we’re considering now. In the digital world the idea was taken up by the free software movement and open culture such as Creative Commons licensing. But it’s wider than that. In computing, the commons consists of the physical fabric of the Internet, of the public standards that make the World Wide Web and other Internet actually work (http, smtp, tcp/ip), of public domain data generated by governments, of the Linux and Android operating systems, of open web browsers such as Firefox, of open collaborative knowledge-bases like Wikipedia and OpenStreetMap. It consists of projects like the Internet Archive, selflessly preserving digital content and acting as the web’s long-term memory. It consists of the GPS global positioning system, invented and maintained (as are many things) by the US military, but now being complemented by Russia’s GloNass and the EU’s Galileo.

All of those are things you can use at no cost, and which anyone can use as bedrock for some piece of data analysis, some business idea, some piece of art, including a million opportunities for making a positive contribution to sustainability. It’s an unbelievable wealth, when you stop to think about it, an amazing collection of achievements.

The surprising take-home lesson for me was: for sustainable computing for the future of the planet, we must protect and extend the digital commons. This is particularly surprising to me because the challenges here are really societal, at least as much as they are computational.

There’s more we can add to the commons; and worse, the commons is often under threat of encroachment. Take the Internet and World Wide Web: it’s increasingly becoming centralised into the control of a few companies (Facebook, Amazon) which is bad news generally, but also presents a practical systemic risk. This was seen recently when Amazon’s AWS service suffered an outage. AWS powers so many of the commercial and non-commercial websites online that this one outage took down a massive chunk of the digital world. As another example, I recently had problems when Google’s “ReCAPTCHA” system locked me out for a while - so many websites use ReCAPTCHA to confirm that there’s a real human filling in a form, that if ReCAPTCHA decides to give you the cold shoulder then you instantly lose access to a weird random sample of services, some of those which may be important to you.

Another big issue is net neutrality. “Net neutrality is like free speech” and it repeatedly comes under threat.

Those examples are not green-related in themselves, but they illustrate that out of the components of the commons I’ve listed, the basic connectivity offered by the Internet/WWW is the thing that is, surprisingly, perhaps the flakiest and most in need of defence. Without a thriving and open internet, how do we join the dots of all the other things?

But onto the positive. What more can we add to this commons? Take the African soil-sensing example. Shouldn’t the world have a free, public stream of such land use data, for the whole planet? The question, of course, is who would pay for it. That’s a social and political question. Here in the UK I can bring the question even further down to the everyday. The UK’s official database of addresses (the Postcode Address File) was… ahem… was sold off privately in 2013. This is a core piece of our information infrastructure, and the government - against a lot of advice - decided to sell it as part of privatisation, rather than make it open. Related is the UK Land Registry data (i.e. who owns what parcel of land) which is not published as open data but is stuck behind a pay-wall, all very inconvenient for data analysis, investigative journalism etc.

We need to add this kind of data to the commons so that society can benefit. In green terms, geospatial data is quite clearly raw material for clever green computing of the future, to do good things like land management, intelligent routing, resource allocation, and all kinds of things I can’t yet imagine.

As citizens and computerists, what can we do?

  1. We can defend the free and open internet. Defend net neutrality. Support groups like the Mozilla Foundation.
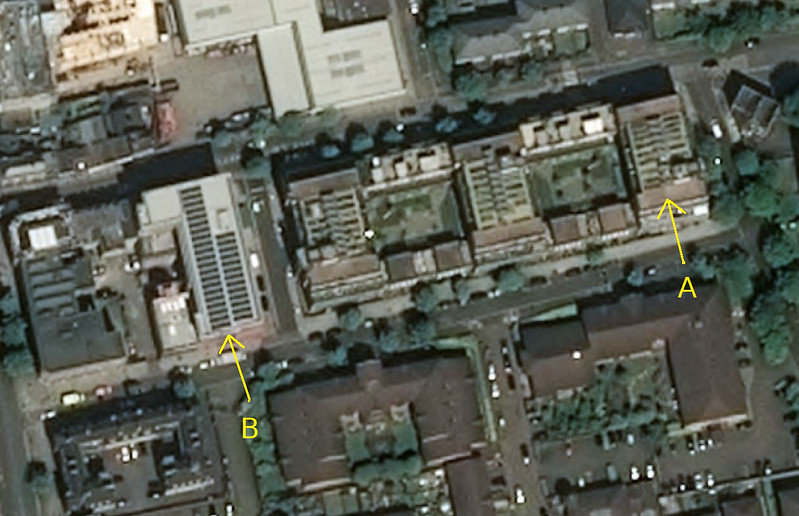
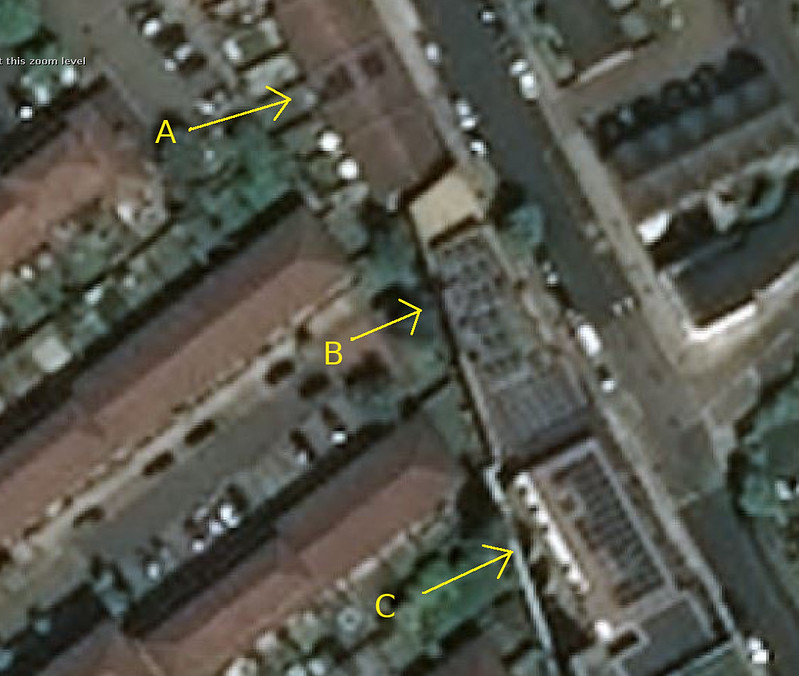
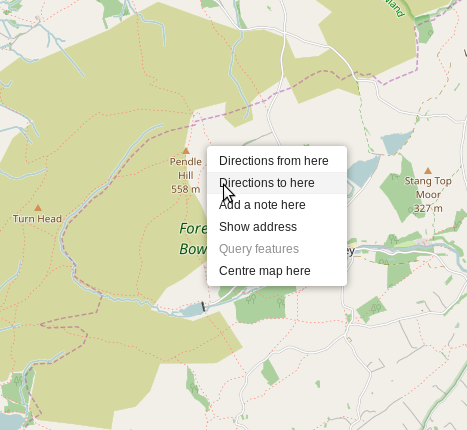
  2. Support open initiatives such as Wikipedia (and the Wikimedia Foundation), OpenStreetMap, and the Internet Archive. Join a local Missing Maps party!
  3. Demand that your government does open data, and properly. It’s a win-win - forget the old mindset of “why should we give away data that we’ve paid for” - open data leads to widespread economic benefits, as is well documented.
  4. Work towards filling the digital commons with ace opportunities for people and for computing. For example satellite sensing, as I’ve mentioned. And there’s going to be lots of drones buzzing around us collecting data in the coming years; let’s pool that intelligence and put it to good use.

If we get this right, 20 years from now our society’s computing will be green as anything, not just because it’s powered by innocent renewable energy but because it can potentially be a massive net benefit - data-mining and inference to help us live well on a light footprint. To do that we need a healthy digital commons which will underpin many of the great innovations that will spring up everywhere.

RFC: wikidata->osm lookup table

Posted by mcld on 22 March 2017 in English.

OpenStreetMap has a wikidata tag which lets us connect OSM objects to their corresponding Wikidata items.

(Technical note: it’s a “same as” relationship - i.e. the tag asserts that the two items in different systems refer to the same entity. However, sometimes things in OSM are split into multiple objects; and sometimes one object in OSM actually refers to multiple items in Wikidata. So it’s actually a “many-to-many” matching, not “one-to-one”: a single OSM object sometimes has multiple semicolon-separated Wikidata identifiers, and multiple OSM objects sometimes have the same Wikidata identifier.)

There are over 600,000 OSM objects with the “wikidata” tag. OK great, job done? I mean, nothing’s ever “complete” in these big open-ended crowdsource projects, but if we have more than half a million crosslinks between the systems, that’s really good going.

BUT THERE’S A PROBLEM!

Using the tag to jump from OSM to Wikidata works fine. But from Wikidata to OSM? Well, there’s no persistent way to link from wkd->osm, simply because OSM’s identifiers are impermanent - they’re not guaranteed to continue existing, or to continue referring to the same thing. So it’s not particularly sensible to store OSM identifiers in Wikidata. Instead, an Overpass lookup is required.

For example, on the OSM Wikidata page I found this friendly Wikidata interface called “Reasonator” - all very nice, but instead of cross-linking immediately to the OSM object, it offers a little “Overpass” link which you can click to do a dynamic lookup.

The effect is that it makes Wikidata->OSM connections indirect, obscured, only-for-those-who-know-they-want-it. If a Wikidata coder says “OK great how do I jump to the item in OSM?” you first have to teach them what Overpass is and how it relates to OSM, then how to use its query language, how many queries a day you’re allowed to do on Overpass… bleh.

PROPOSED SOLUTION

Pretty simple proposal, then: a script that produces a Wikidata->OSM lookup table. This could be run as a weekly cron job perhaps (or something monitoring minutely diffs for any changed wikidata tag? dunno) and it could produce a lookup table that is easy for non-OSM users to consume. For example, it could produce a big CSV file like this:

 Q1002133,node/29541385
 Q1002826,node/20919015
 Q1002845,node/241795518
 Q1004173,way/38387732
 Q1004824,node/29164070
 Q1026205,node/410291638,relation/1061137
 Q1005234,relation/2797450
 ...

and a JSON file like this:

 {
 "Q1002133": [["node",29541385]],
 "Q1002826": [["node",20919015]],
 "Q1002845": [["node",241795518]],
 "Q1004173": [["way",38387732]],
 "Q1004824": [["node",29164070]],
 "Q1026205": [["node",410291638], ["relation",1061137]],
 "Q1005234": [["relation",2797450]],
 ...
 }

and then what might be useful could be for these to be published at a stable location, for other programmers to make use of dynamically. The intention is to make it easy for someone with no OSM knowledge and no GIS knowledge to be able to hook OSM into their open data ecosystem.

I wrote a Python script that makes these lookup tables. On my home desktop, it takes about 2 minutes to scan the UK extract; for the whole planet file, it takes a lot longer… 90 minutes! Oof. (The CSV and JSON files produced are 14 MB & 19 MB in size.)

Your thoughts?

It gives me great pleasure to announce that the OpenStreetMap website now has a context menu! Also known as a right-click menu:

Context menu in action

You might not think this is big news, but I do. A few people asked for this feature in the past, and eventually I proposed some code for it. It took 18 months for the proposal to be merged into the website codebase - why? Primarily because OSM is built and run by volunteers with limited time, but also because my Javascript skills weren’t quite up to adding the important polish and tests that are needed for production-ready code. A million thanks to Tom Hughes for improving my not-quite-finished proposal, and for all the feedback that helped me understand how to do things right.

When we run mapping parties as part of the HOT work, we see lots and lots of newcomers mapping for the first time. Increasingly we’re getting them using iD which is very easy for them to get started with.

One little issue I noticed in sessions is that for HOT we ask people to use very specific changeset comments - essentially to “tag” the changesets as belonging to a particular labelled task. It was very easy for people to spend half an hour mapping and after half an hour have no memory of what we said about copying-and-pasting a specific comment. Workflow problem!

Now, the team who create the iD editor kindly added my feature request which means that the HOT Tasking Manager can now “pre-fill” the changeset comment in the iD editor. So no need to copy and paste, it should be there when you click through from the Tasking Manager.

What does this mean? It means that in future, HOT mappers using iD will not need any reminding about what to put in the comment box! Easier mapping, easier training, more consistent changeset comments.

Thanks everyone who helped put this through.

(P.S. There is one little technical niggle to resolve - if the comment contains an equals sign then the pre-fill doesn’t work on firefox. Hopefully sorted soon.)

London: Searching for Globe Town

Posted by mcld on 7 September 2014 in English.

In East London, there’s a part of Bethnal Green called “Globe Town”. It’s not very well known, but it’s actually indicated by some globe artworks sprinkled around the area - see the photo in this nice article, for example: http://hidden-london.com/gazetteer/globe-town/

I decided to go and do some Bethnal Green mapping today, at least in part because Globe Town wasn’t really in OSM yet and also because I’m not even aware of an official definition of the bounds of Globe Town. So I went looking.

my fieldpaper

I’ve placed a marker to name the Globe Town locality, and I chose to place it in the Globe Town market square. Is that the centre of Globe Town? I have no idea. But it’s at least a prominent place associated with that name.

I also mapped one of the Globe Town globe artworks. I’ve seen a few of them around but I can’t remember where - I’ll just have to add them as I find them.

There are a few different things named “Globe” in that part of town. Of course things named after Globe Road don’t necessarily have to be in Globe Town, so I’m not sure if it extends to the southern end of Globe Road even though I found “Globe Town recycling centre” at the bottom there.

If anyone knows of any clues, please let me know. Otherwise I’ll just have to keep mapping whenever I see a globe…

Well it finally happened...

Posted by mcld on 23 August 2014 in English.

Well it finally happened… last night I went to a pub, and I printed out an OSM map to find the way. However, 8 days earlier, someone had moved the pub to the wrong location! That’s the kind of risk we run in an open crowdsourced system.

Luckily my beer hunting skills outweighed my trust in open data and I found the pub eventually. Pint drunk, map fixed, crisis averted.

I’m at the OpenStreetMap Hack Weekend March 2014. Things done:

  1. One of the things I’m really happy about is that Richard Fairhurst’s addition of routing to the OpenStreetMap main website is really close to being ready - just a couple of tiny bugs and UI bits to iron out, and who knows, maybe it’ll go live soon. I helped with a couple of little improvements and fixes.

  2. The other thing is a conversation with new mapper Micky Allen, who is interested in mapping blue badge parking spaces. It turns out that in OSM we have a handy tag capacity:disabled=*, which is already used quite well in London, but we just need a bit more community effort to map these “blue badge” parking bays whenever we see them. Micky now has some ideas about how to extract these data from OSM, and he also has some ideas about encouraging the community to join in mapping them. I’ll certainly try and remember to map them when I see them.

  3. Next thing we’ve done this afternoon - some improvements to v2 of the HOT Tasking Manager. I’ve made it auto-unlock locked tasks after time (feature migrated from v1) as well as a couple of smaller tweaks.

As a contributor to OpenStreetMap, one thing I’ve been wondering recently is what sort of map data should we collect for the UK, now that the coverage has already got good. Since OpenStreetMap generally has great coverage of the UK, when you’re out and about with a printed-out map and a pen, it’s very rare that you can find much significant that isn’t mapped already - sometimes a new street or a missing church. You could pour your time into mapping increasingly obscure things, whatever you’re interested in. But what would be the most useful things to map in the UK, over the coming year? Things that are not just interesting to map but could be practically useful to people? Some thoughts:

  • Addresses. I kind of don’t like mentioning this, because I find it boring to map addresses, and I’d much rather that the UK address data magically appeared from some big open-data source. But addresses are obviously really useful for so many things: routing, looking up shops, etc. Coincidentally, Simon Poole (chair of OSM Foundation) also says address collection is the thing we need, for OSM in general not just UK.
  • Postcodes. In the UK postcodes are really important for satnav routing etc. For some reason I suspect that collecting postcodes could be less mind-numbing as collecting addresses, but just as useful. See Jerry’s blog about UK postcodes in OSM for an analysis of where we are with postcodes… about 3% of them. As he says, we need to do better than this - so how best to collect them?
  • Footpaths. Really important for planning walking routes, whether in the city or the countryside. We also need to mark when footpaths have steps or are otherwise no good for wheelchairs/prams. (It’s also handy to know when footpaths are full-blown rights of way, or just “permissive” access.) In his speech at State Of The Map 2013, Peter Eastern mentioned that they estimated UK footpath data was still pretty incomplete. I often use OSM for planning walking routes - it has loads of footpaths that no other services have, but I do still often go walking somewhere and find new footpaths that aren’t in there yet. I don’t know how we could specifically push for more footpath mapping - all I will say is please help us and map walking routes :)

Some notes on other things which I’m not sure how vital they are:

  • Buildings. I know when we’ve been doing London mapping meet-ups, Harry Wood has mentioned that OSM’s buildings coverage for London is rather patchy. You can see it on the map - there are pockets full of buildings mapped, and large pockets with none. But… is this a bad thing? What would we want buildings mapped for? I know they’re useful in fancy 3D map renderings, but for more practical purposes…? I’m guessing it’s not that crucial, though it might relate a bit to the address mapping.
  • Shops. It’s great to have shops, restaurants, pubs and other local businesses in OSM. Once you start mapping these, though, you notice there’s quite a rapid turnover - your high street probably gains/loses a shop every 3 months or so, at a wild guess. So this data is useful, but it’s less permanent than all the other stuff I’ve mentioned so far. I’d suggest there’s no point having a big push to map every shop in every high street, we just need to let the momentum build to a point where that happens under its own steam.
  • Postboxes. Again Jerry has a detailed breakdown, and says we need to map them more. Plus Robert Whittaker has some data mining tools about postbox completeness. On the other hand, is it really that urgent to map postboxes? It doesn’t feel anywhere near as critical as mapping addresses, walking routes, etc. The only use case I can think of is “where’s the nearest postbox?” which is rarely a critical matter.
  • GPX traces. After MapBox published their beautiful rainbow GPS map tiles which provide a lovely way to see the GPS traces contributed by the community, I noticed at least two villages where there were basically zero traces uploaded. Are GPS traces important to UK mapping? The coverage of the aerial imagery is good, and generally quite well GPS-aligned, so… do we need more GPS traces around the UK? I genuinely don’t know, and would be interested to find out either way.
  • Grit bins. Something I noticed a couple of winters ago - it would be really handy to have every grit bin mapped: one day, when it’s freezing cold outside, all the grit bins are hidden under a foot of snow, and you need to clear a driveway, it could be really handy. That’s just one little thing that I don’t think anyone has particularly focussed on, so a little call out - please map amenity=grit_bin when you see them!

I’d be grateful for any feedback on the thoughts above, including other things that could be priorities. Just one UK mapper’s perspective.

Originally posted on my own blog

Remember to map post-boxes

Posted by mcld on 5 October 2013 in English.

I don’t think I used to map post-boxes. Partly because I’m not that interested in them, partly because I sort of assumed they should have been imported en masse at some point from a Royal Mail open data dump of some sort (naive?).

But when I read SK53’s interesting post about the completeness of post-box mapping in Britain, I was really surprised to learn that OSM had less than 50% of the postboxes in Britain. So I’ve started mapping post boxes when I come across them.

As it turns out, I could have started with the one at the end of my road. It was already there in the map, but it had the wrong reference number, though I only noticed that recently. Even in central London and central Birmingham (two hyper-mapped cities) I’ve found some postboxes that have sat there unmapped for years.

Anyway, a quick search finds that I’ve added or fixed 79 post-boxes in the map so far. Mappers, next time you see a post-box, please map it - post boxes are useful things to have on a map…

One of the great things about editing OpenStreetMap is that it leads me to discover new bits of my local area. I’ve just come back from a lovely walk in North-East London, a walk which I would have never thought of doing if it hadn’t been for OSM. And what’s more, it led me to discover a really lovely seafood place for lunch!

Here’s how I do it:

  1. When it’s a nice day and I fancy a walk, I go and look at ITO’s FIXME map, which simply highlights all the objects in the map with “fixme” tags. Most of the time the issues described in the tags are things that can be fixed if someone goes to survey the place (e.g. “check name”, “does this footpath really exist”). I pick a few of these fixmes, not too far from home, as waypoints for my walk.
  2. I usually also go to walking-papers and print myself a simple walking map of the area. I note on this map, the things I need to check.
  3. Then I go and walk. These days I usually record the GPS trace of my route using my Android phone (I use the “OSMTracker” app) - it’s handy but not necessary; just walking around with the piece of paper is fine. For some purposes I prefer scribbling on paper, while sometimes it’s quite handy to store notes in the phone.
  4. When I come back, I upload the GPS trace and use my notes to update the map, fixing things and removing the “fixme” tag wherever I’ve actually fixed something. The aerial photos that OSM offers (via Bing etc) help to jog your memory as you edit, and often prompt me to add features that I didn’t explicitly note down while I was walking.

Really the best thing about this is that while I’m directly fixing things that people want fixing, I’m also discovering bits of my local area that I had no idea about. There was one walk where I discovered an entire park in North-East London that I had never heard of before (and wasn’t properly mapped yet, either).

The highlight of today was that my route led me past a fantastic seafood place, and just in time for lunch as well!

Rejigging the OpenStreetMap browse page

Posted by mcld on 21 September 2013 in English.

On OpenStreetMap, I find the /browse/ pages really useful for getting a quick summary of an “object” in the map. It shows when it was edited, shows all the tags, etc.

However, I have two issues with it:

  • The use of space isn’t ideal. There’s plenty of unused space which I don’t think is entirely deliberate (of course whitespace is good sometimes) - and the interesting information often gets pushed down below the fold as a result.
  • The browse pages have enough information that they should be generally useful, not just as a diagnostic tool for mappers, but maybe for people who want to share the details of the pub they’re going to, or whatever. The main impediment to this is that the initial impact of the page is fairly unfriendly and technical.

I believe the layout can be rearranged in a way which doesn’t remove any of the information that mappers need, but which makes the browse pages more accessible and friendly and hopefully generally useful. This would encourage more casual users to see the tags we have, and… fix them :)

So the main objectives are:

  • Make the main heading a bit more approachable, making the “name” (where available) a bit more primary than it currently is.
  • Make the “Tags” section a little bit more visually primary (more approachable to newcomers than changeset).
  • Make the “last edited” info more compact - it doesn’t need to be a four-row tabulation, but can be as a sentence “Last edited [date] by [user], (version [v] in changeset [c])”. It makes sense to put the “View history” link at the end of this too. Also, it’s more approachable to have the last-edited-date converted to something like “2 months ago”, and for full info it’d be good to have the full date tooltippy.
  • Try not to do anything that prevents experienced mappers from getting a visual overview of the more technical info, such as history, XML link, edit links etc.

Work so far is in my github branch called “browsepage”.

I’ve written a bit more on my own blog including screenshots.

I really think the “Last edited N decades ago by Thor” is much more approachable than the current table of metadata. The other stuff I’ve done is less dramatic, but I like the way it gives a bit more priority to the tags and makes room for plenty of them in a screenful.